At Adaptyv Bio, we are on a mission to enable protein designers to focus on doing what they do best — designing proteins — while our automated lab handles the experimental characterization of their designs.
With this case study we’re launching a series of real-world benchmarks to understand how the current state-of-the-art protein design models perform in the lab.
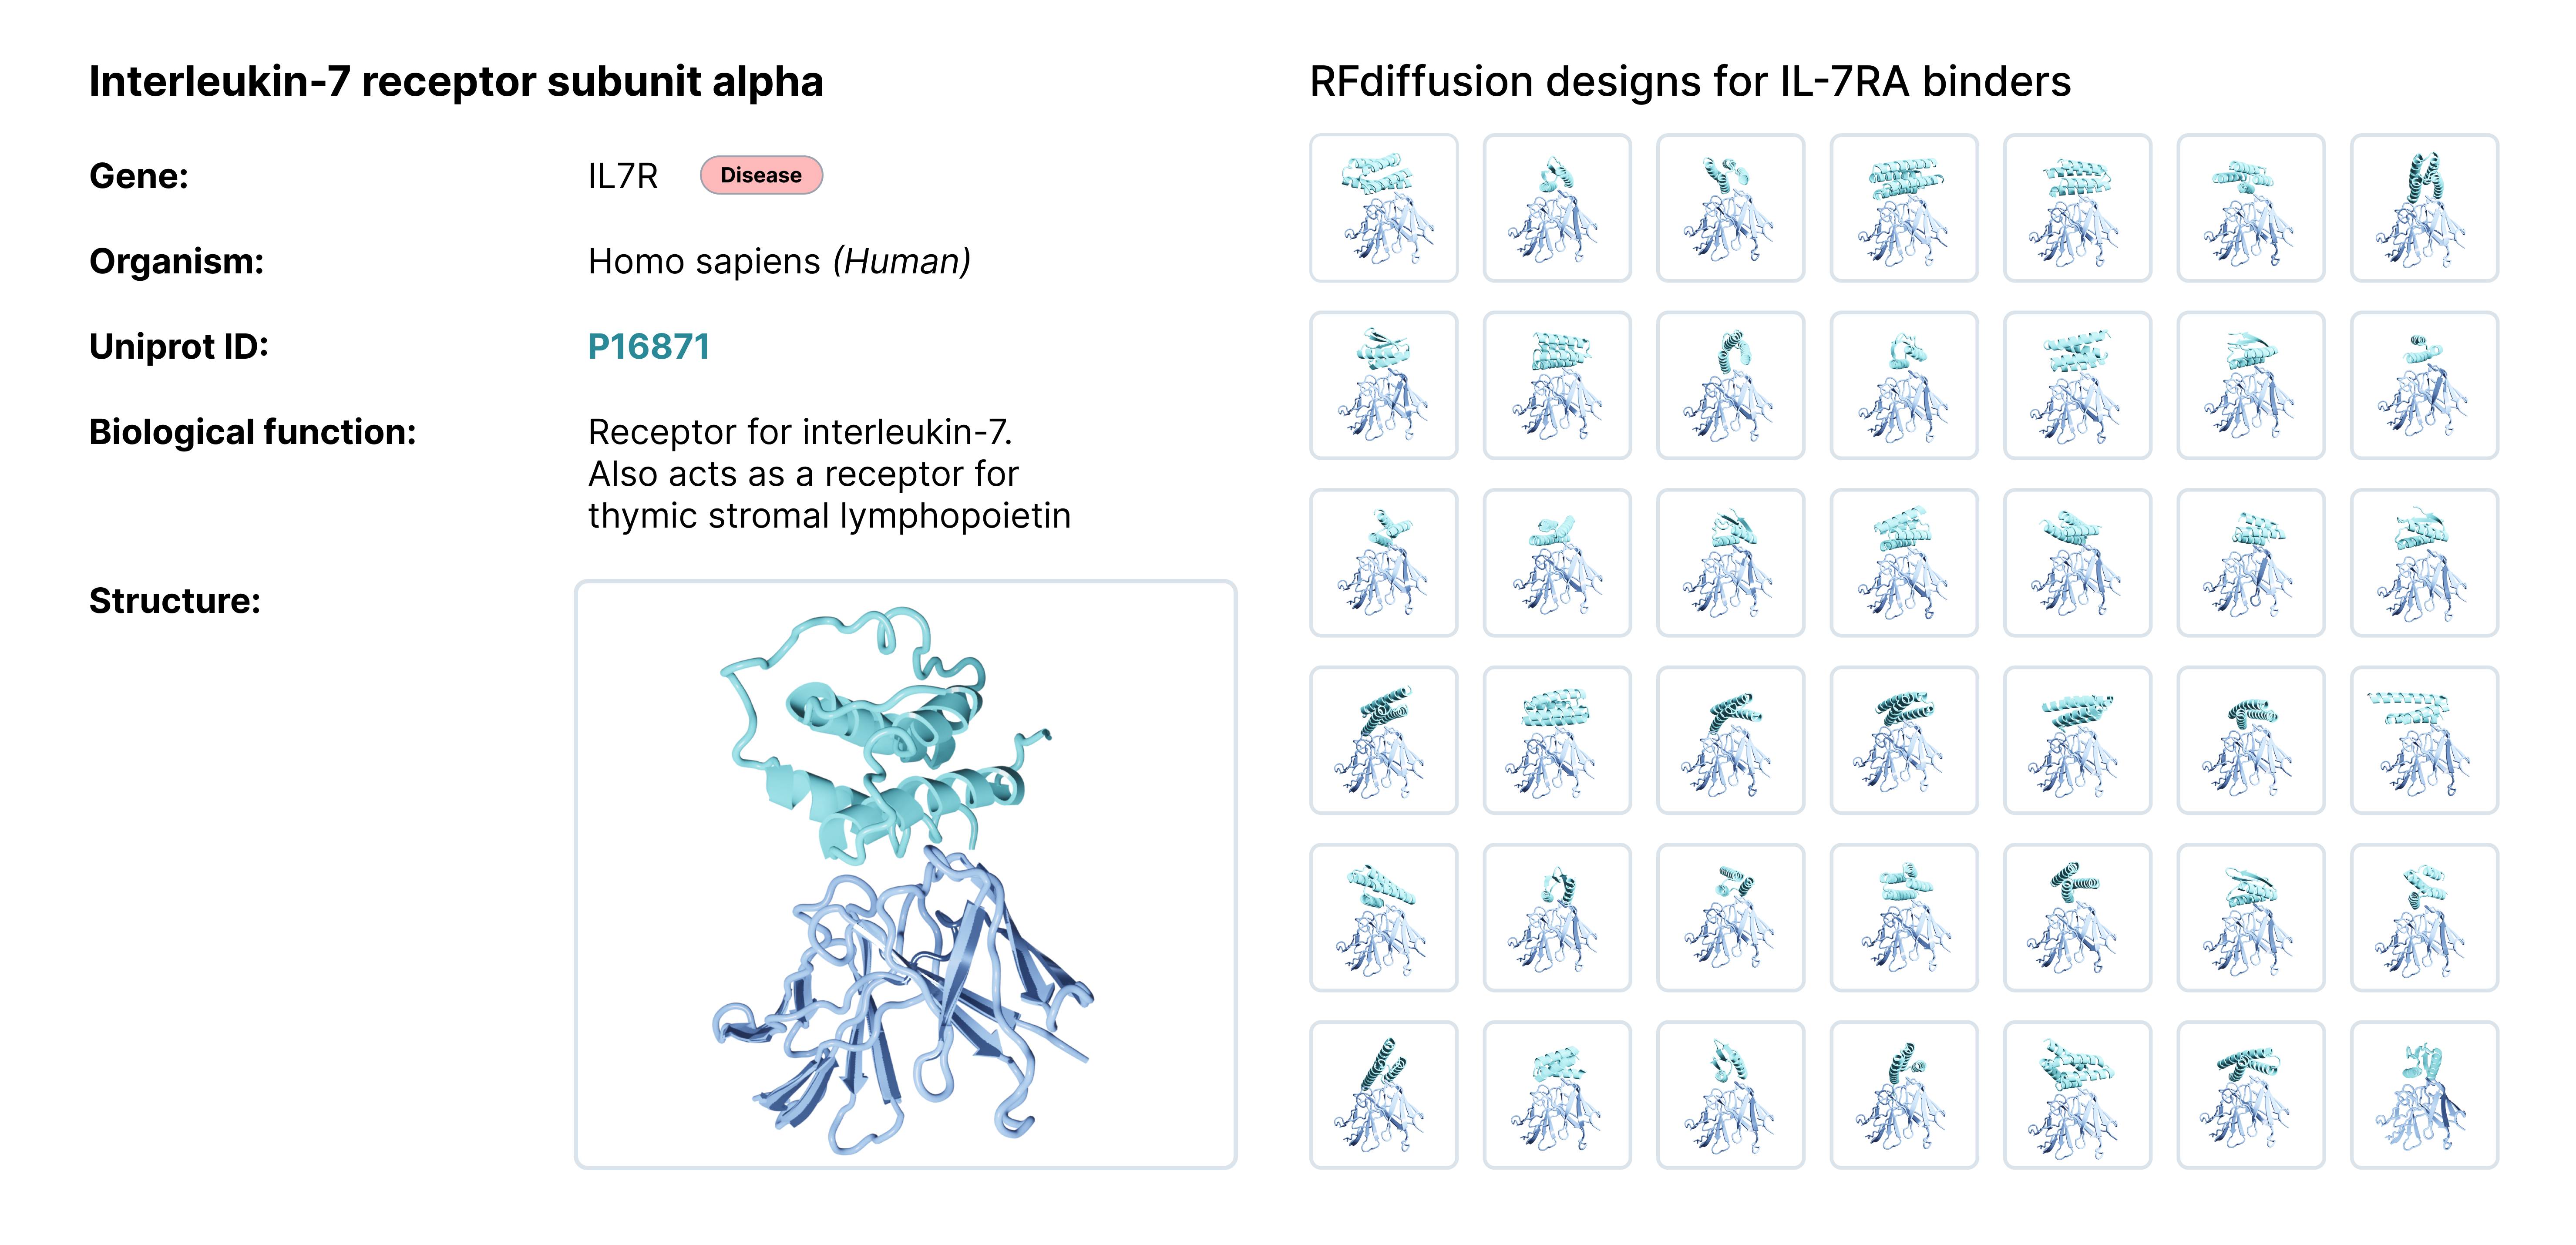
In this test case we’ll validate designs published in RFdiffusion (Paper, Code, Notebook) from the Baker Lab at the Institute for Protein Design. They built a computational pipeline composed of RFdiffusion, ProteinMPNN and AlphaFold2 to design de novo binders for several human and viral proteins and reported success rate around 2 orders of magnitude higher than previous approaches.
Here, we show that we can validate their results using our Affinity Characterization workflow to determine binding strengths of de novo designed proteins.

Case study
For this benchmarking study we focused on AI-generated designs against Interleukin-7 receptor-α (IL-7Ra), a protein involved in several inflammatory and autoimmune related related disorders.

In the paper, they experimentally tested 95 binder designs for IL-7Ra and found 32 sequences that bind to the target. We took those 32 binding sequences as well as 10 randomly selected non-binders for a total of 42 designs and ran them through our Affinity Characterization workflow to see how the results hold up. You can find a detailed comparison of the experimental workflows in our repository. The entire workflow from receiving the DNA to processing the experimental data took approximately 16 hours and less than 20 minutes of manual handling.
Let’s take a look at the results now!
Binding classification
First, we can look at how the results of our approach compares to the results obtained in the screening assay from the paper. We found:
- Out of the 32 proteins that were identified as binders in the RFdiffusion paper, we classified 27 as binders based on a threshold value identified from the negative control. The other five proteins (IL-7Ra_binder_design_9, _11, _17, _31, and _52) did not show a significantly higher signal than our negative control. However, our assay setup (see Repository) uses an analyte concentration that is lower than what was used in the paper which could result in a detection threshold that is too high for very weak binders. On the other hand, increasing the analyte concentration more can also lead to non-specific binding, making it hard to distinguish ‘real’ binding. Interestingly though, two of these five (IL-7Ra_binder_design_9 and _52) were identified as top 20 binders in the paper, with reported KDs of 787 nM and 465 nM, respectively. We repeated the measurement for these two variants in separate replicates, but binding to IL-7Ra remained undetectable.
- Among the 10 proteins classified as non-binders in the original paper, we found 9 to be non-binding. For the remaining protein (IL-7Ra_binder_design_12), interestingly we detected weak binding with a dissociation constant (KD) of 6.4 µM.

Affinity characterization
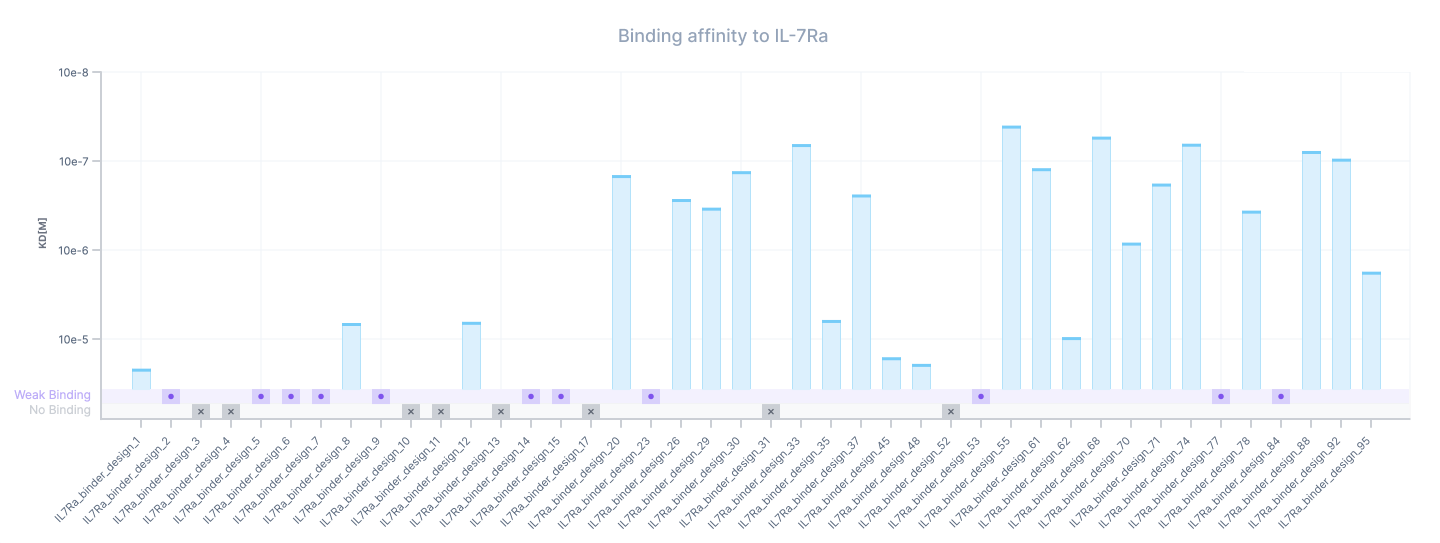
Now we can look at the full affinity characterization data for all the variants that were screened in our assay. In comparison to the paper where affinity characterization was only done for the top 20 binders, we decided to run the full affinity characterization workflow on all the 42 variants including the ones classified as non-binding. This allows us to extract the kinetic profile for more variants including some of the weak binders.
Variants that showed signal during the assay but where our data processing pipeline was unable to fit them were marked as weak binding (likely above 50 uM). The data and results can be explored directly in the Foundry Portal.
In summary, we could fit KDs for 23 variants with affinity ranging from 10’s of µM (10e-5) for weakest binders (small bars) to 10’s of nM (10e-8 to 10e-7) found on the strongest binders (tall bars). Most of the binders are concentrated in the 100’s of nM range with the strongest binder reaching 40 nM binding strength.

Association/Dissociation curves
Let’s look at some example curves to see what distinguishes a non-binder from a binder in the BLI assay.
For each of the four different designs below we’re showing the binding signal as shift (in nm) vs time (in s). The RFdiffusion designed proteins are immobilized on the sensor surface. We bring them in contact with the Il-7Ra solution at different analyte concentrations for the first half of the experiment to see them binding and then for the second half of the experiment we let them unbind. By measuring association and dissociation we can calculate the binding strength (the dissociation constant KD).
- For a non-binder (here IL-7Ra_binder_design_17) we see a completely flat curve without any binding (and thus also no unbinding).
- For a weak binder (here IL-7Ra_binder_design_8) we see a little bit of binding signal at the highest analyte concentration (when it is the ‘easiest’ for the protein to bind to Il-7Ra).
- Then, for medium binder (here IL-7Ra_binder_design_26) we clearly see binding and unbinding for multiple analyte concentrations and we can fit the curves (dark overlay) to calculate the KD
- Lastly, a strong binder such as IL-7Ra_binder_design_55 shows binding signal at all but the lowest analyte concentration, with clean curves and good signal to noise ratio.

Affinity Comparison
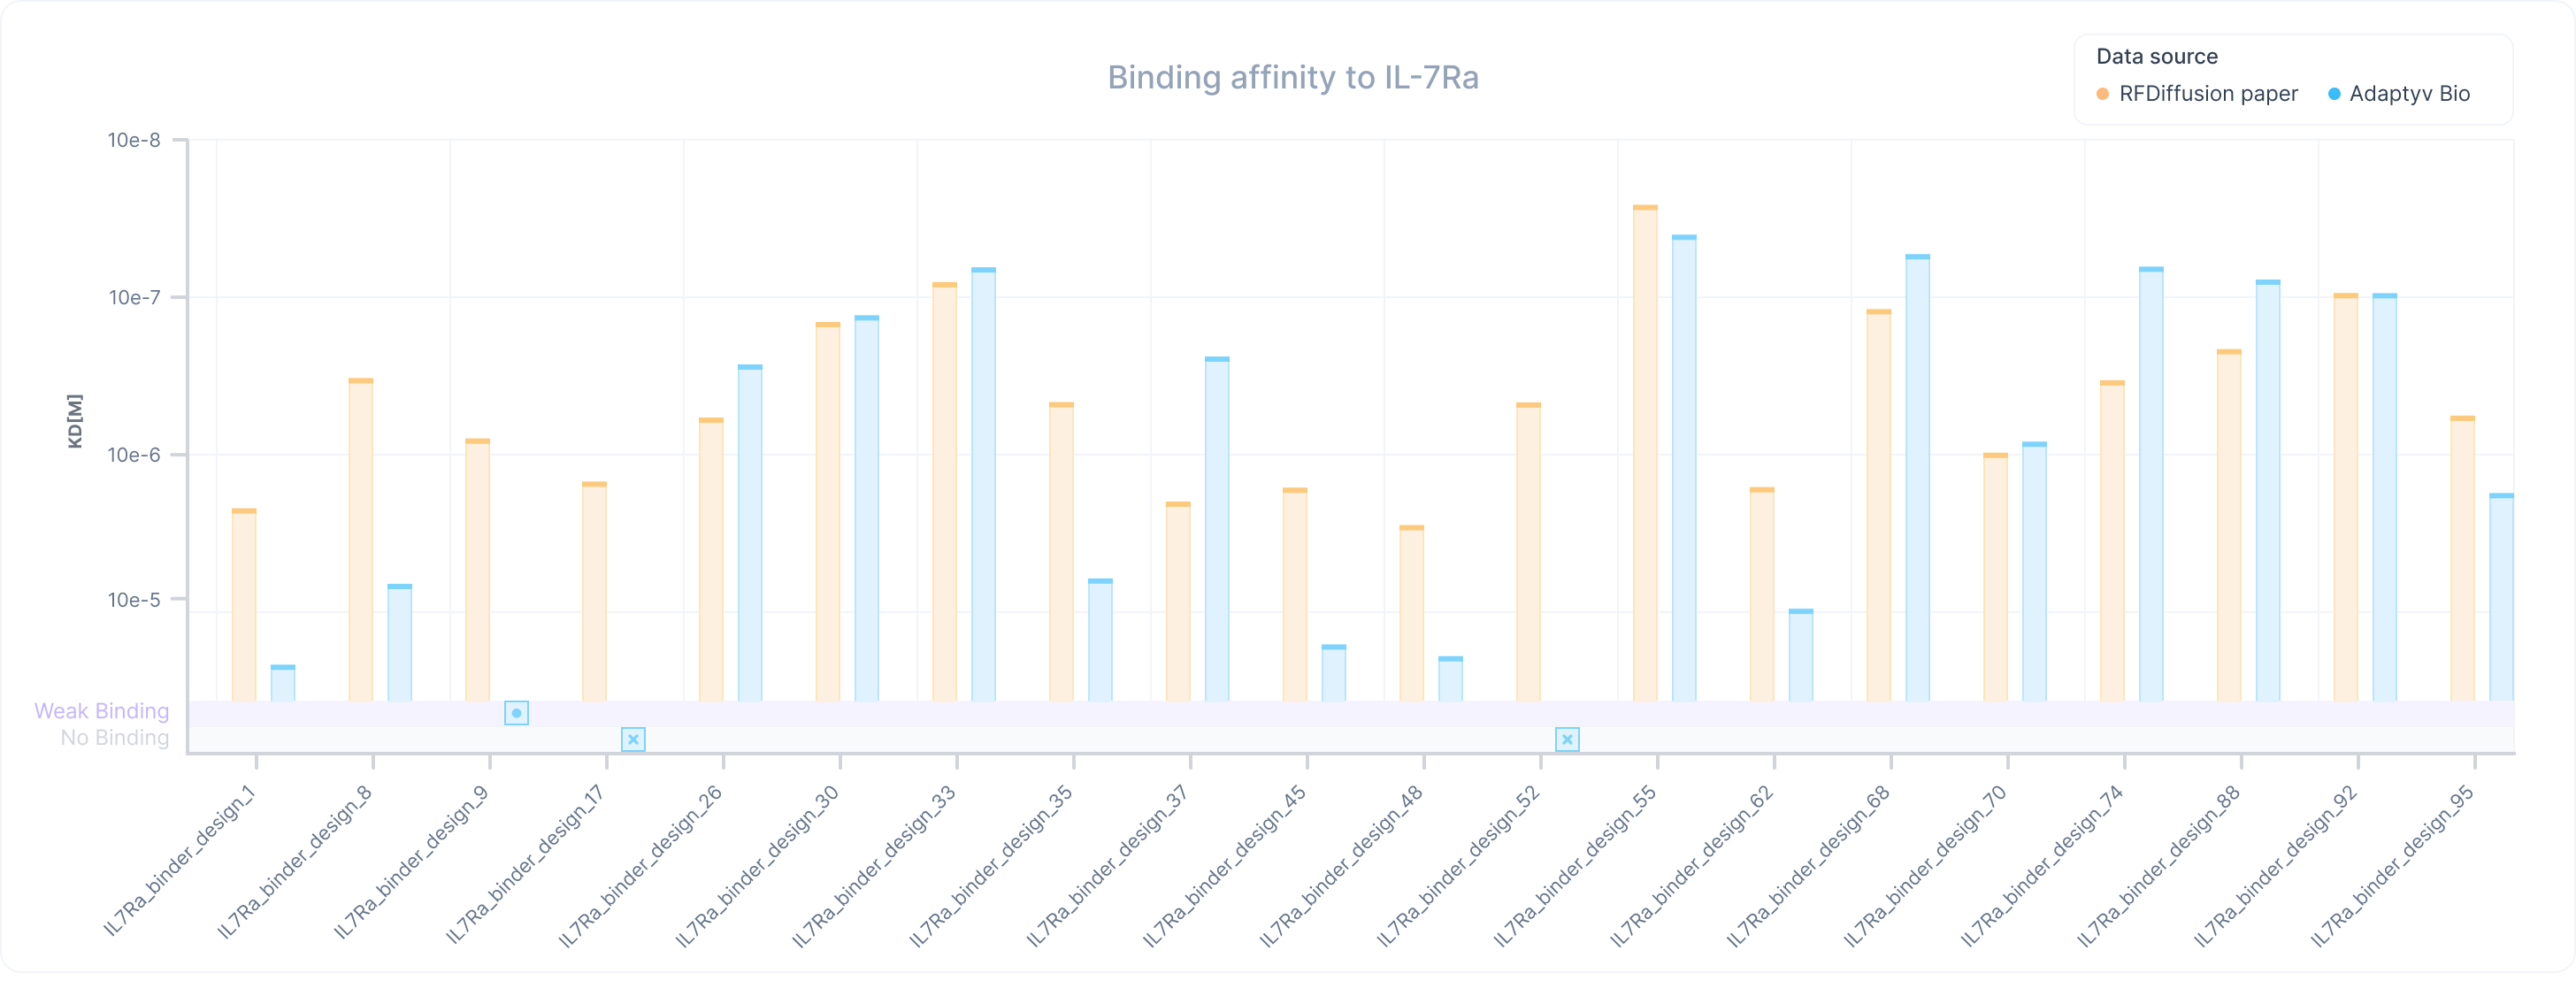
Now, let’s compare the KDs to those available in the paper. In this case we see that most of the variants correlate well with the data presented in the paper. On average, the paper measurements are within 0.3 orders of magnitude compared to our results. We only see some deviations between the measurements in the low affinity range (below 1 uM), where the reported results of the paper tend to overestimate the affinity of the binders. These differences can be expected since the exact conditions of the assay couldn’t be replicated and typically have a higher impact on the binders that present lower signal-to-noise ratios.

Conclusions
Our data confirms overall the results from the paper and the capability of the RFDiffusion sequences to bind to IL-7Ra across a wide range of affinities. Interestingly, while we were unable to detect the binding of five of the weaker binders presented on the paper, we managed to fully characterize all of the high-affinity variants as well as some additional ones that were excluded during the screening in the original paper.
In general, this data validates what the original paper demonstrated: RFDiffusion can effectively generate protein binders to therapeutically relevant antigens. Although the best performing binders from the paper present modest affinity to the target compared to other biologics currently used in the clinic, this is a great step in the right direction. It showcases how these models can increase the efficiency and speed at which new therapeutics are discovered. Importantly, further characterization is needed to assess other crucial properties like specificity, immunogenicity, and stability.
All the data from the test case including the raw data and methodology is available here.
If you want to design protein binders against IL-7Ra yourself, you can test them by simply going to our Experiment Configurator, selecting an experiment and typing in IL-7RA as the target. After you submit the experiment configuration, we’ll send you an invite link to our Foundry Portal where you can upload your sequences, confirm the quote and start the experiment!


